This is a writeup from a series of talks and workshops I’ve given on this topic.
So far:
- Part 1 introduced the topic, and took a look at how not estimating at all can work
- Part 2 and part 3 explored using data instead of asking people how long they think things will take
- Part 4 looked at how wide, uncertain ranges can still be useful
This post, part 5, describes a workshop to help practice coming up with those ranges – a way to make them just wide enough so you’re confident they include the right answer. This skill is useful for much more than just “how long would this take?” – it can be applied to all kinds of usage, value and risk questions.
How good an estimator are you?
A long time ago (in 2006!) I came across a quiz on the Coding Horror blog. It has 10 trivia questions (like “What’s the surface temperature of the sun?”), and invites you to choose a low and high estimate for each, making these far enough apart so you’re confident there’s a 90% chance the correct answer is in your range. Don’t look anything up – this is about expressing what you know right now. The follow-up post has the answers and a bit of discussion about what’s going on.
If you’re really choosing ranges that have a 90% chance of having the correct answer, then you should get about 9 out of 10 right – but I got a much, much lower number. The quiz comes from Steve McConnell’s Software Estimation book (mentioned in part 1), and the story behind it is fascinating. Steve gave this quiz to hundreds of people in training courses and found the average score was 2.8 out of 10. His conclusion? “Most people’s intuitive sense of ‘90% confident’ is really comparable to something closer to ‘30% confident’”. Similar results have come from other studies.
These questions aren’t about work things, but it’s a similar skill – often we’re asked to estimate things we know little about, and expressing how uncertain our range is would be useful. And these trivia questions should be easier to get the right range on – in a work context, factors like these are likely to be driving low estimates and too-narrow ranges:
- I know everyone would like this to be a low number, or less than x
- I would like this to be a low number, I feel confident I’m a productive person
- I shouldn’t give a wide-open range, I’m a professional who should have some confidence in things
- … and more
The conclusion in Steve McConnell’s book was: relying on intuitive judgement is really unreliable, stay away from it! The rest of the book has a huge range of useful techniques to try.
A long, long time later I found another book with a similarly-structured quiz – and some really interesting ideas on how to improve this “30% confident” situation.
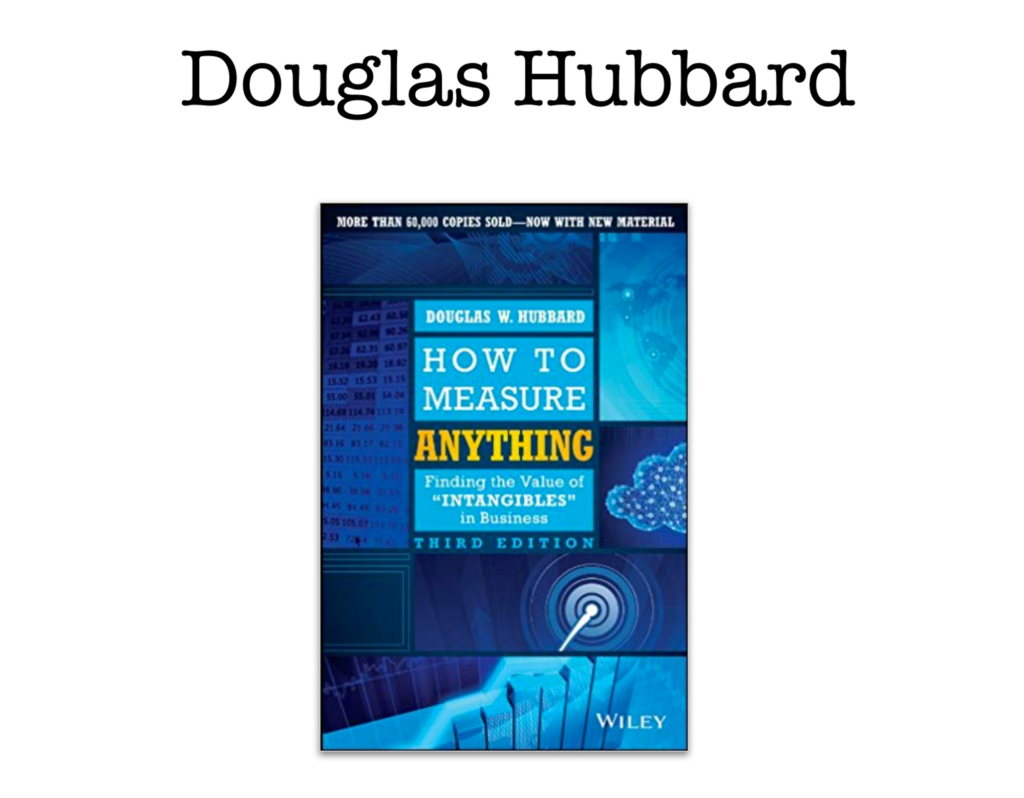
How to Measure Anything is a wide-ranging book, packed with straightforward explanations of maths techniques that can really help you in your work. I’ve never found anything so accessible and interesting for getting into what sounded like some daunting topics. And in chapter 5, he describes a workshop he’s used for helping “calibrate” people’s sense of “90% confident” for questions like these.
I’ve tried it out, and found:
- It’s actually useful: People really do come out with a much better sense of what “90% confident” means – and the trivia practice applies to work situations too, so when someone gives a wide uncertain range it now tends to have the actual answer in there much more reliably.
- It builds understanding: At some level, I think some roles in a team just don’t get why it’s so hard to get an “accurate” answer to “how long will this take”. By getting the whole team (and people around it if you can) to take part, people experience for themselves how often they’re wrong and how much uncertainty you need to be comfortable with.
- It’s useful for estimating more than time and effort: Questions like “how many people will use this thing anyway” and “how much extra income might this bring” are in the exact same class of difficult-to-answer, but you-can-say-something question. Often these don’t get the same attention.
So, running a half-day workshop with your team will, at the least, give everyone a bit more insight and understanding into why this type of question is hard to answer. And maybe you’ll also be encouraged to put more focus on those usage and value questions – if it’s more roles on a team who put their expertise into giving best-guess answers, you might shift from the same few people getting put on the spot towards a more whole-team approach to doing your best to predict an uncertain future.
What do you know right now?
To help run the workshop, I’ve made a spreadsheet you can copy and edit: What do you know right now?
The format of the workshop (described in How to Measure Anything) is straightforward:
- For a set of 10 trivia questions, give upper and lower bounds so that you have a 90% chance of them including the correct value. Don’t look up the answers.
- Try using 5 different techniques to help calibrate your answers (described below)
- Get given the answers, total up your score, and repeat.
After not too many rounds, you should find most people moving towards about 9 out of 10 scores; and they should feel a better appreciation for the traps that gave them trouble in the early rounds.
Introduce everyone to these 5 techniques – encourage people to try out tall of them, and decide which ones seem most helpful for them personally.
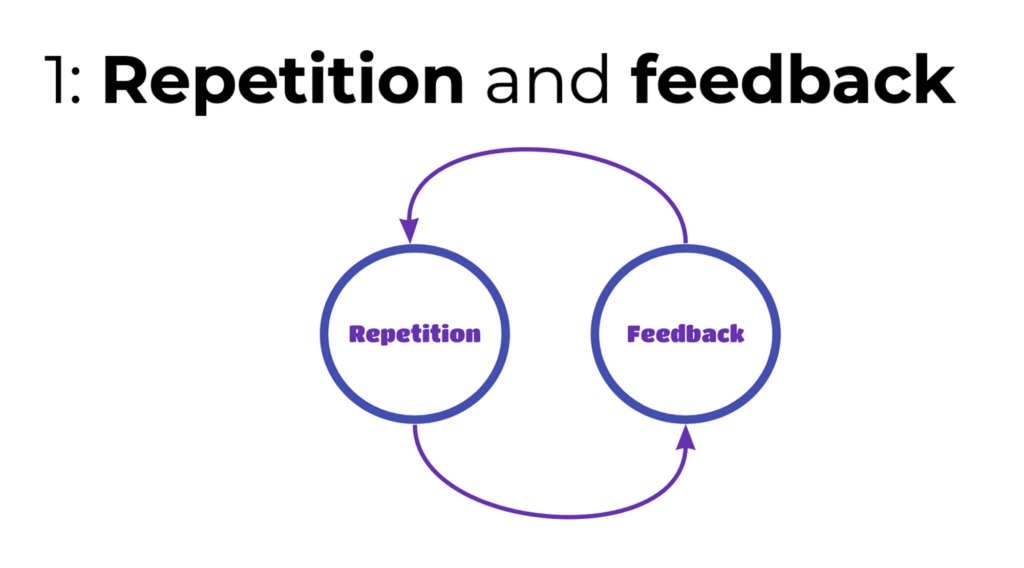
This comes naturally as part of the workshop: give answers, find out how wrong they were, and reflect before trying again.
It’s worth thinking about how much this happens in your normal work: We get asked for inputs for planning, or for business cases – how reliably do you hear back how that matched up with what actually happened? Would more of that help give better answers in future?
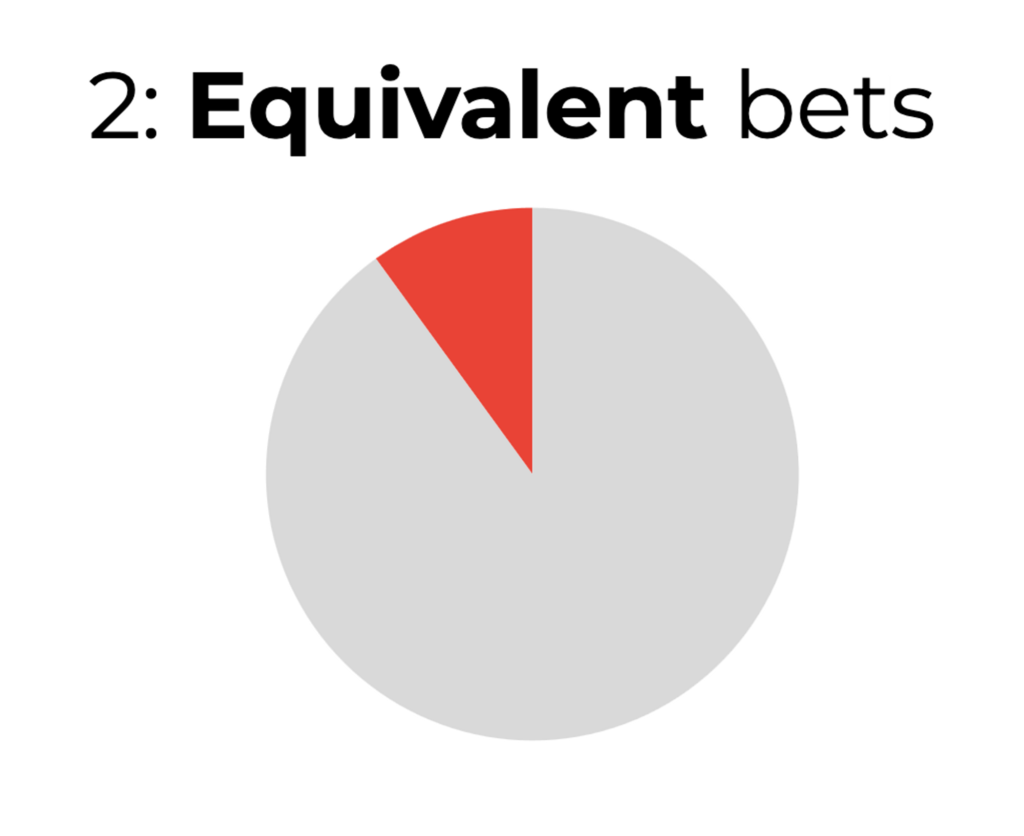
Most of us don’t have a good sense of what “90% confident” means. An exercise that helps: look at your answer to one of the trivia questions and imagine you could choose to play one of two games.
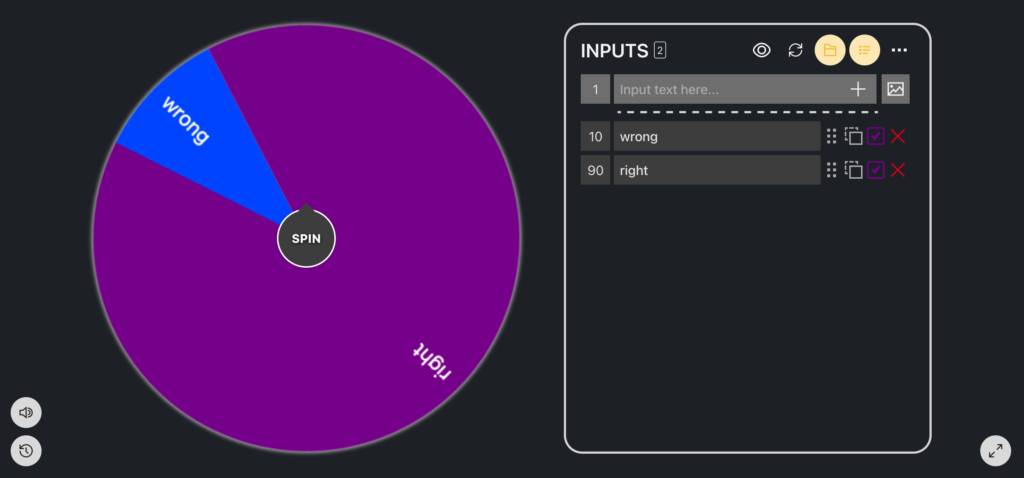
- For the wheel shown above, you could spin it with a pointer. If the pointer comes up anywhere in the grey area (90% of the wheel), you win £1,000. If it comes up red you win nothing.
- Or, you could look at your answer range. If the correct answer is inside that range, you win £1,000. If it’s outside you win nothing.
Which game would you rather play? If you’re like most people, you’ll think that the wheel game sounds much more appealing. This is a sign that your range is too narrow. You should widen the range, as much as you need to, until you don’t mind which game you play – either one looks like a similar chance of winning.
The handy thing about this exercise, according to Douglas Hubbard: studies show it works just about as well when we just do this thought experiment, without having to actually pay you the winnings. That’s nice, because it saves a fortune 🙂
It’s worth spending time on this exercise, to really get a feel for what 90% means beyond “quite a lot of confidence”. More than the static image, actually spinning a wheel helps me – online, https://pickerwheel.com/ lets you try this out. Or you get people to have a go with protractors and spinning arrows.
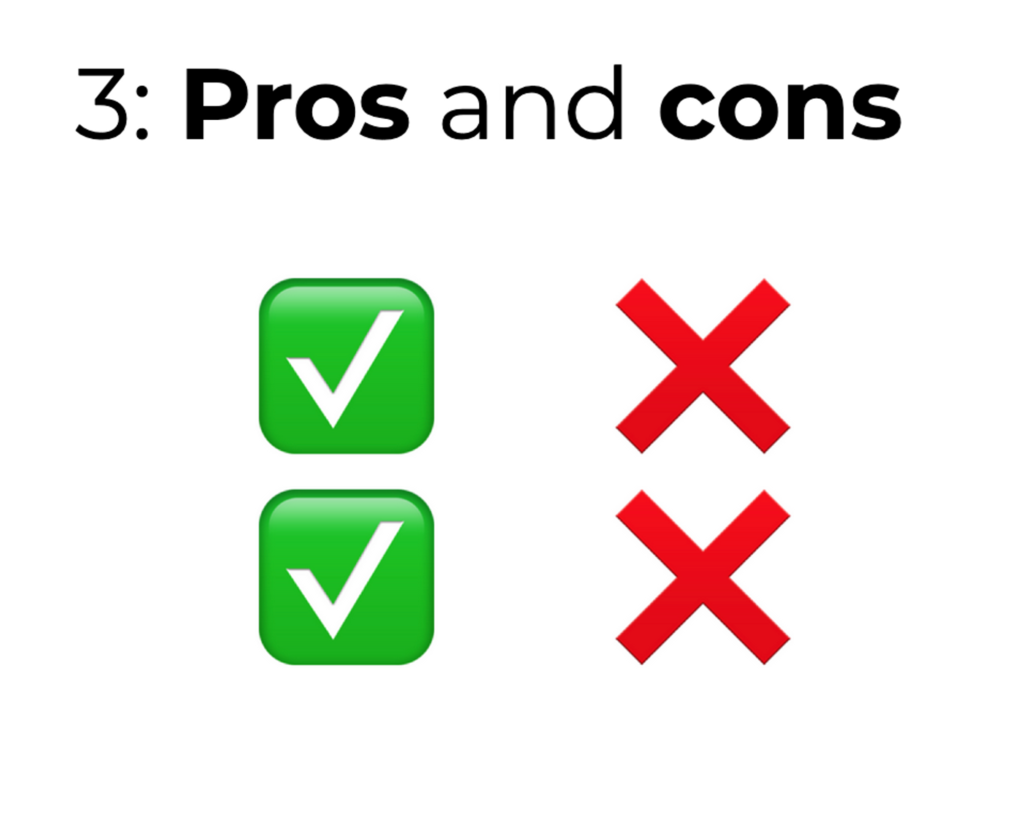
Next: Think of 2 good reasons why the correct answer might be inside your range – and 2 good reasons why it might be outside.
For trivia questions, this is a good prompt to think of any supporting facts or comparisons – and for work questions, it’s a chance to look at whatever patchy or partially-relevant data you might have.
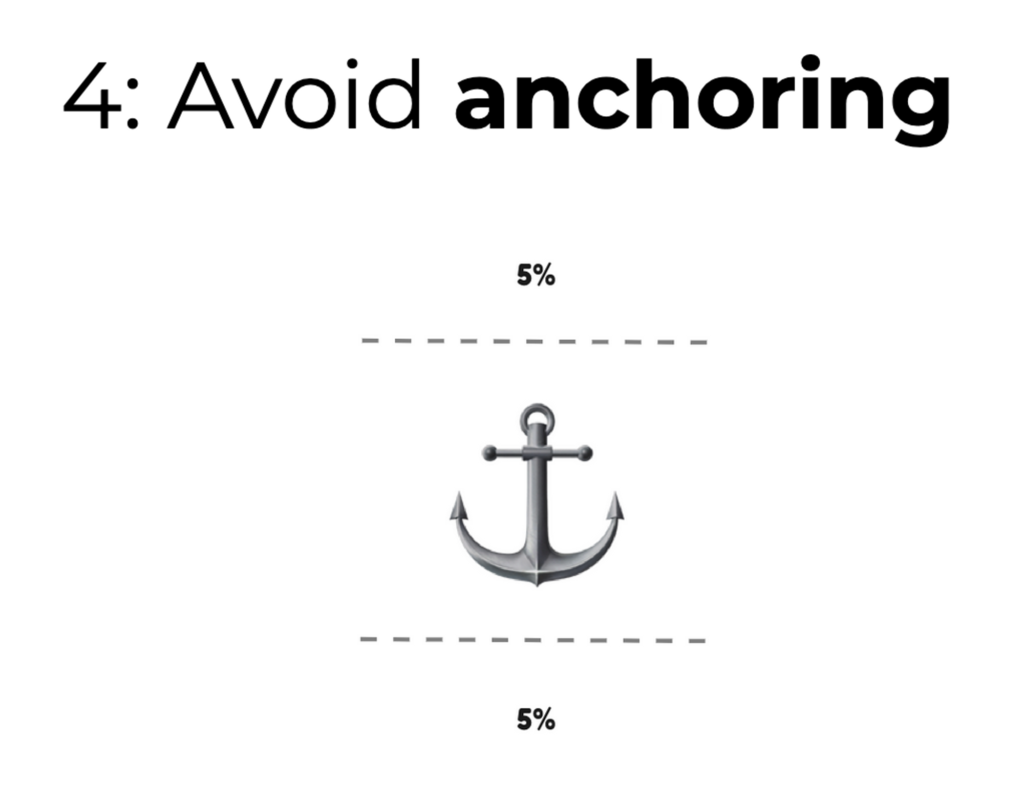
The anchoring effect is a real, and powerful, phenomenon: Whatever number we first think of “pulls” the edges of our range towards it. If you’re asked about how tall a tree is, if your first thought is “maybe 20 metres?” then your overall range will end up much lower than if you started from “maybe 100 metres?”
To help with this, you can try to flip the question: rather than thinking of an initial guess and imaigning the bounds moving away from that, look at the lower bound and think “is there really only a 5% chance that the true answer is lower than this?” 5% is a very small, but still possible chance. Then move to the upper bound an think about the chance of being higher than that.
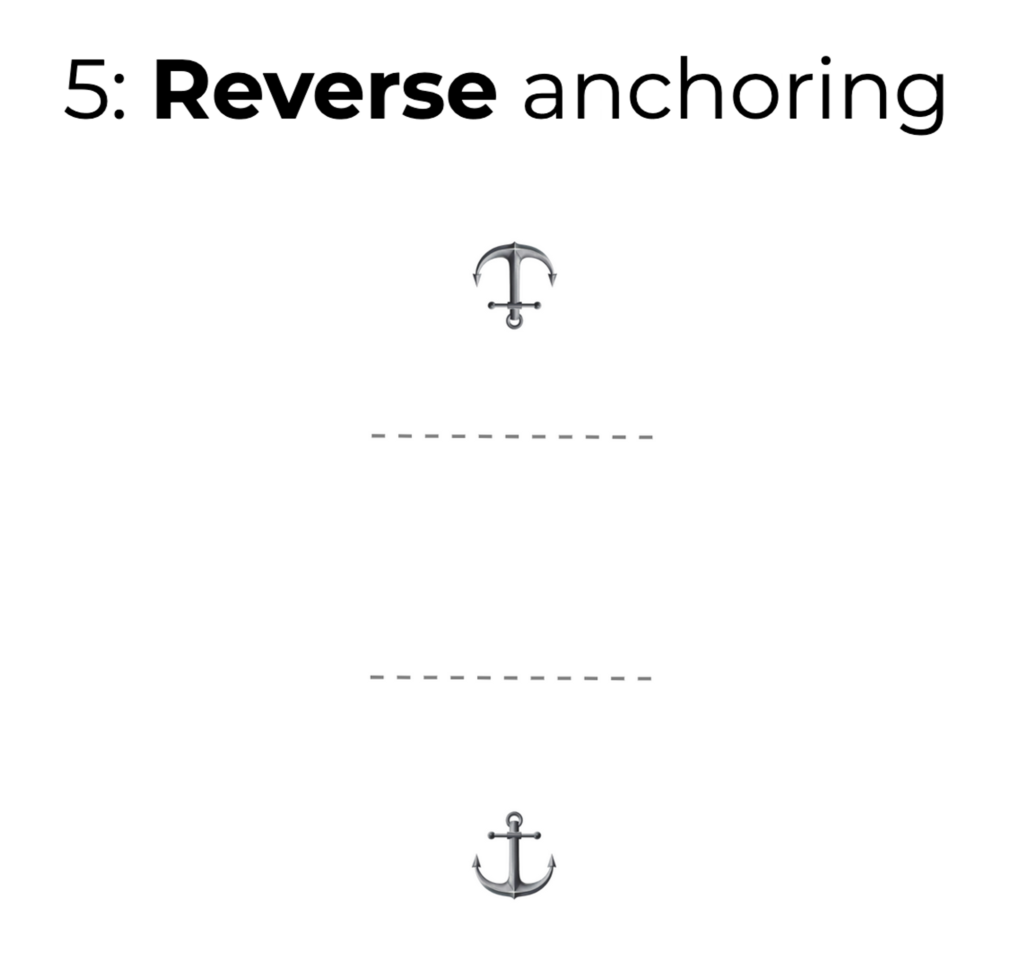
This last technique can be thought of as looking for the edge of absurdity. Instead of starting with an initial guess and trying to widen out from there, you can start with a wild, absurd value and gradually move in from there. Want to know when a company was founded, and think you have no idea? Start in stone age times – that’s clearly wrong. Move in steps until your reaction changes from “clearly that’s wrong” to “well I don’t think that’s right … but I suppose…” That’s the edge you’re looking for.
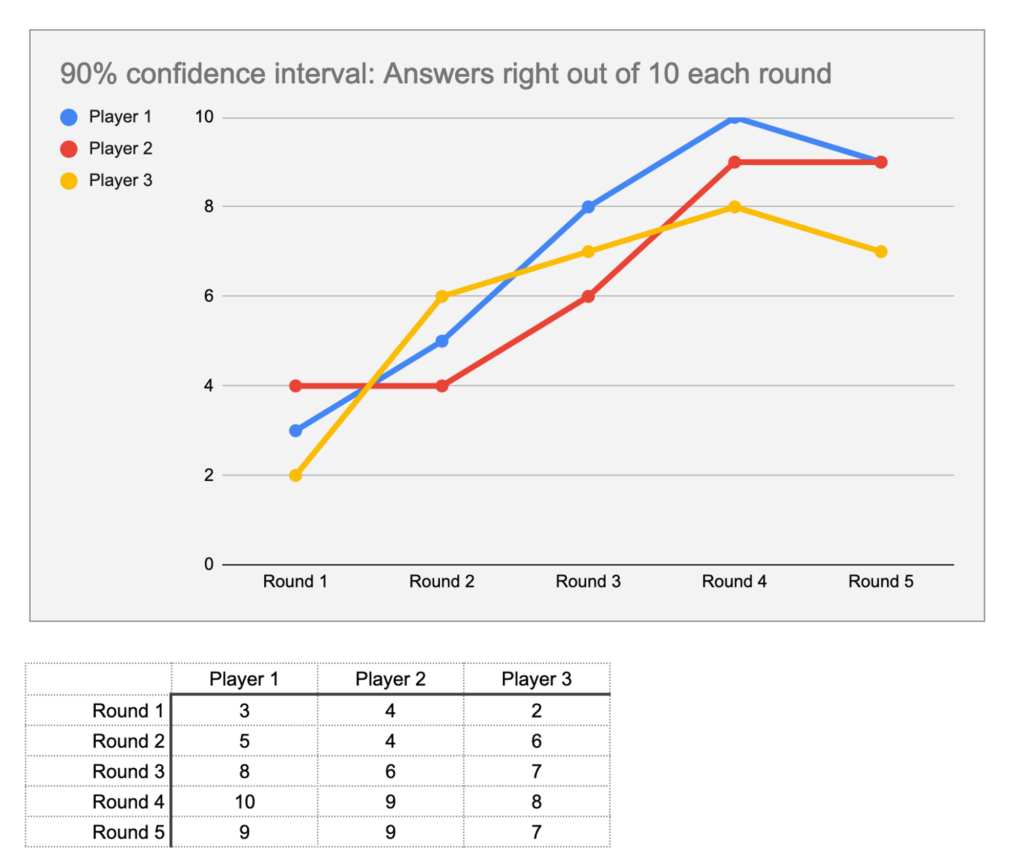
Keeping track of progress
The “Results” tab has a chart you could in the workshop use to track the team’s scores through several rounds – hopefully you’ll see the scores move towards 9 out of 10 over several rounds. You can delete the placeholder data and start filling in your own.
This sheet has another chart, with notes, for tracking scores on true/false questions as well as these range ones – that’s a useful variation you can try.
Coming up with questions
Before you start the workshop, you’ll need several sets of 10 questions. I’ve included a few sample question sets in the spreadsheet, but I encourage you to have a go at making your own – it’s fun! The “Ideas for questions” tab can help get you started.
From the list of prompts, pick a kind of measurement, and a question topic. See what question ideas come to mind and go look up some facts. The answers in the example question sets have some good links you can explore: Wikipedia is a goldmine, nasa.gov is full of facts, and dimensions.com is really fun to explore.
Next in this series
I hope you’ve found this workshop description helpful – and I’d encourage you to use any skills gained from it only when you have to. If there are several tasks weekly where you’d like to ask people how long they’d take, maybe have another look at parts 1 and 2 of this series – you can probably do without that overhead.
We’re getting near the end of this series – in part 6, we’ll take a look at some of the cognitive biases and difficult personal dynamics that make estimation such a surprisingly difficult subject to talk about.