This is a writeup from a series of talks and workshops I’ve given on this topic. It’s been really helpful to think through what techniques I’ve used, what situations each work best in, and what less-than-obvious challenges make this such a hard topic to give simple answers on.
Part 1 introduced the topic, with a few thoughts on one approach to #NoEstimates: actually not talking or thinking too much about how long anything will take, and what kinds of situations I think can make that work well or poorly.
In this post, part 2, we’ll talk about another approach I see people use the same #NoEstimates hashtag for. Then, part 3 gives some advice for getting started with this yourself.
Let the numbers do the talking
Sometimes, when people advocate #NoEstimates, what they’re suggesting is you should capture data on how long work takes, and use that to answer questions and make decisions on what work to do and when to expect things to be done. It’s possible to make detailed forecasts and consider lots of different options.
When I’ve looked into this approach – can we use data instead of having to put people on the spot with “how long do you think this will take” questions – here’s some resources I found incredibly helpful for getting started. These aren’t necessarily people who used the #NoEstimates hashtag much – not everyone would say “using data instead of opinions” means you’re not estimating.

Cat Swetel’s talk “The Development Metrics You Should Use (but Don’t)” is a brilliant, encouraging way to get people interested in using metrics. There’s no need to have done lots of maths before, or to start off with any very complicated tracking. If, for each work item, you keep a note of when it starts and when it finishes, you’ll have all you need to start creating all the insightful charts and stats that Cat goes on to demonstrate. There are lots of examples of how to make these useful for teams and stakeholders.
That talk recommends several places you can go on to learn from. Dan Vacanti’s Actionable Agile Metrics for Predictability book has a huge range of practical advice on how to capture and interpret metrics, and how to use what you find to improve things. After I read it, I used spreadsheets to implement the techniques he recommends, but he also sells software that can pull data from various work tracking tools and easily make interactive visualisations.
Another amazing resource is Troy Magennis’ FocusedObjective site, so many spreadsheets and other tools you can try out.
Is this … estimating?
Probably an argument of semantics! Lots of people’s experience of estimating is that horrible, put-on-the-spot, question about how long something fairly undefined will take, with accompanying worry that the answer will come back to bite you later. Dispassionate discussions about what the data shows feel very different.
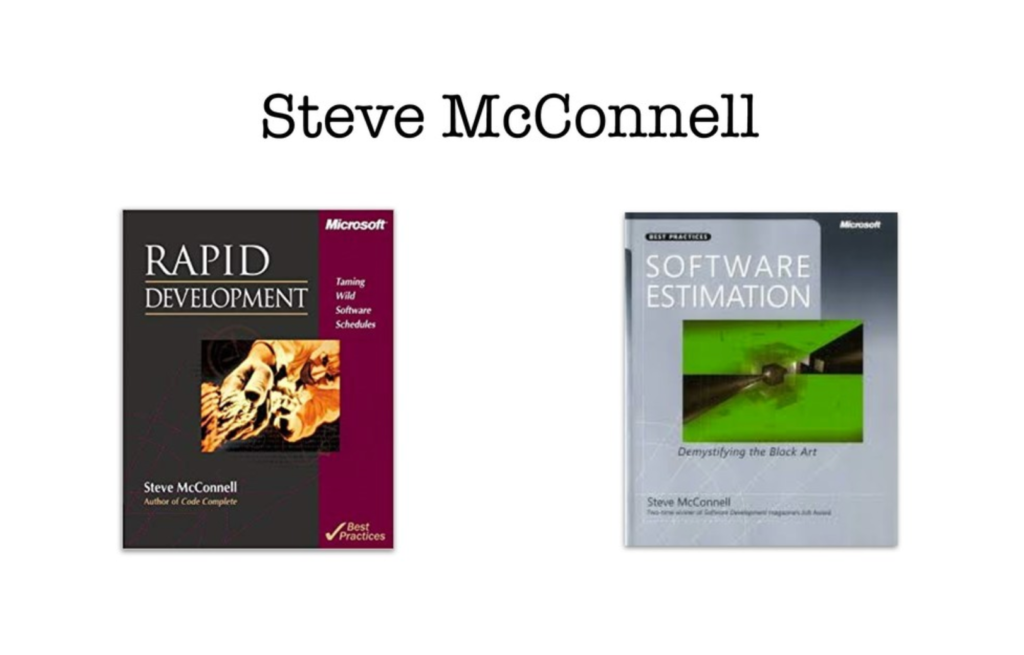
But lots of people have included using data in their advice on estimating. Some of the most useful books I read (a long time ago), and still find very useful now, were from Steve McConnell.

Software Estimation: Demistifying the Black Art is very clear on some aspects of estimation:
- Counting up anything you can and using it for data is best, and using your “expert judgement” (opinions) should be a last resort
- Estimates that are a single point (a date or an exact duration) are leaving out vital information; you always have a range and a likelihood of hitting that range
- Most importantly: How to get anyone to listen to you! With advice on telling the estimation story, understanding what stakeholders are looking for, and helping people be comfortable with uncertainty.
My experience
Could I see this working? Absolutely – I’ve found tracking start / end dates, and using them to track work in progress, cycle times and throughput, incredibly helpful. On one team, we felt work was really unpredictable – it felt like anything we started might turn into a multi-month saga of dependencies and unexpected complications. Loading historical data into a spreadsheet started giving us some insights right away.

The team had been T-shirt sizing some items, but not others, and weren’t sure how much it helped. Looking at the data we found:
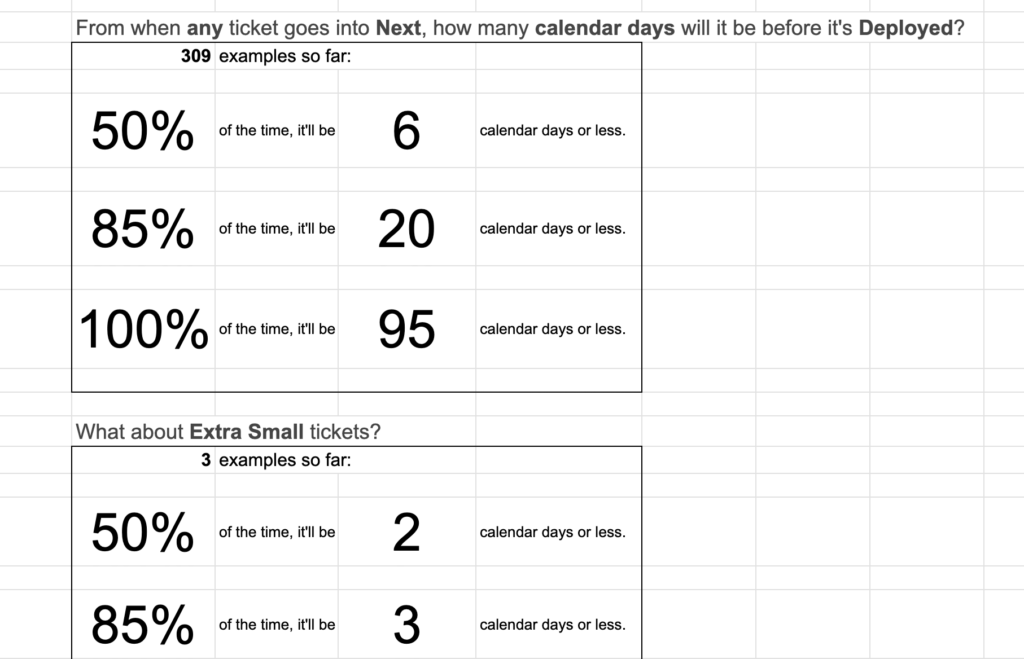
- If you don’t take any size information into account, most of the things we took on actually got finished in under a week (50% of things got done in 6 days or less).
- The “multi-month odyssey” did happen, but more rarely than we’d thought – things like that tend to exaggerate themselves in your mind. It was reassuring to see it wasn’t as likely as it had seemed.
- When we said something was “extra small”, we really could be confident about it – in under 3 days it’d be done with, unless something very unexpected came up.
- When we said “small” or “medium” that didn’t actually give much predictive power – there was a fairly wide range of times, and there was basically no difference at all in the expected cycle times whether it was small or medium (in fact, medium items tended to finish slightly quicker than small ones).
- When we said “large”, we really meant it – every thing that had been given this label took a long time, noticeably longer than other size categories.
Reviewing this, we decided that calling things “extra small” was still useful – when we say that, we’re sharing info that this’ll be done much faster than a typical item. And if something looks “large”, don’t do it. We should dig into what makes it large and change it. In between those, we didn’t give things a size – they’re the right size to just get on and do.
For those large items, we asked: What was it about them that took the time? We’d been doing sizing based on discussions of effort, complexity and risk: it’s not necessarily that something’s a big job in terms of amount of code or design involved, it could be about the unknowns and aspects of it that could trip us up. Looking for common qualities in the longest-running things, we found that it was where we depended on other teams that things got slowed down.
And the data showed more than that: When we had 2 or more items in process that needed coordinating with other teams everything in the process took longer. You could see in the charts how the cycle times of all our work got dragged up. For this team, we had a fairly good handle on Work In Progress – when someone finished an item, they looked back across the board for any opportunities to help someone else get a thing finished rather than start on something new – but it was Dependencies In Progress that we needed to start limiting. Once we’d seen the pattern, we realised reasons for this being such a problem. Working with another team meant a fair bit of coordination, and when we had more than one item like this the same key people from our team kept being off in meetings and discussions, leaving other work and team members waiting for them. By adding a new policy – don’t start a new item with dependencies if there’s already one in progress – we kept our flow of work smoother and our predictions of “When will things be done” much more useful.
These changes might sound like common sense – but once we’d started collecting and looking at data, we could spot just how much chaos some things we were doing were causing to our predictability and flow of work. And it’s not the same answers on every team – the type of work and team in this example meant that this “Dependencies In Progress” concept was hugely important, but in other places I’ve not found the same culprit. What’s important in the teams you work with now?
Is this always a good approach?
Are metrics like this always useful? I’d say yes – but there are some conditions that make them much more useful than others. For predicting how long things take, you need previous examples to calculate from – not hundreds of items, but certainly tens of them. And if you try changing things, you need to wait for a few items to go through before knowing if that’s helped. What type of work item are people asking about when they want estimates? In some teams I’ve been on, the things people care about were huge and long-running, so we might only get 2 or 3 data points a year.
I don’t think you can get around this by describing a huge piece of work as hundreds of small “user stories” and tracking those (I’ve tried) – if you need to complete all of them before you release something that users, stakeholders, and your product manager care about, you’re kidding yourself. There’ll be lots of unfolding stories added as you realise things you missed, and you don’t actually know how “done” you are until the very end when you need to test it all together, and integrate it, and try it under load … there may well be people who’ve had more success than me, but in my experience, if people are asking “when will it be done” and mean “the whole big website” rather than any of your arbitrary divisions of the work, then the approach we’ve discussed in this post isn’t really that helpful.
Another consideration: predictions from these metrics are most useful when the future you’re trying to predict is similar to the past you got the data from. If your team is adding or removing people, or the type of work seems quite different (a new technology, or a move from enhancing an existing website to building an entirely new one), then be skeptical of how well the predictions will hold up. Metrics can still be very useful as an input to discussions (”with our team that had worked together on this app for years, we’d expect x – so with us replacing 2 of the most experienced members with new joiners it’ll certainly be a fair bit longer”).
Next in this series
In part 3 I’ll give a few more practical pointers on getting started with this kind of data. Everything you need is in the resources I pointed to – but I know “watch all these videos and read a bunch of books” isn’t always the most useful advice, so I’d like to give a short, practical, “getting started” walkthrough to let you try this and decide if you want to learn more.
Then, in part 4 and part 5 I’ll try giving some ideas you can use when you’re in one of those “these techniques won’t work so well for my situation” cases.
Finally, part 6 gives some ideas to keep in mind no matter what estimation techniques you’re using. Hopefully these will help you get the most out of estimation, while putting the least time and effort into it.